The live code-graph demo on our CGraph project page is a single self-contained HTML file — CGraph's own graph.html export, run on its own repository — embedded in a click-to-load, sandboxed iframe. There is no graph database behind it, no charting library fetched from a CDN, and no runtime computation: the ~1.2 MB file carries the graph data and the renderer inline, and the page it lives on ships zero extra JavaScript until a visitor asks to see it.

This post walks through the three pieces that make that work: the export format, the embed, and the provenance gate that keeps the demo honest.
The demo is the export, not a copy of it
Every cgraph --root . --out cgraph-out build writes a graph.html alongside graph.json — an interactive viewer meant to be double-clicked from disk. The demo serves that exact artifact, unmodified. What you pan and zoom on the project page is what any user gets locally, which is the point: the demo demonstrates the exporter, not a bespoke web app that flatters it.
The file on the page today is CGraph's graph of itself, and its numbers come straight from the build that produced it (more on that in the provenance section):
One file: data and renderer inline
Self-contained means the graph JSON is embedded directly in a <script> block:
const graphData = {"nodes":[...],"edges":[...]};
Inlining a multi-megabyte JSON payload into HTML has one classic footgun: if any string in the data contains </script>, the document breaks (or worse, becomes an injection vector). The exporter escapes every </ sequence as <\/ while streaming the payload into the output buffer, so the embedded data can never close its own script tag — and it appends in place rather than materializing a second copy of the serialized graph.
The renderer is equally dependency-free. It draws to a single <canvas> with the 2D API — no SVG, no DOM node per graph node, no d3. At 1,300 nodes that choice is comfortable; a DOM-based viewer would be fighting layout and memory long before that.
Three details do the heavy lifting for legibility:
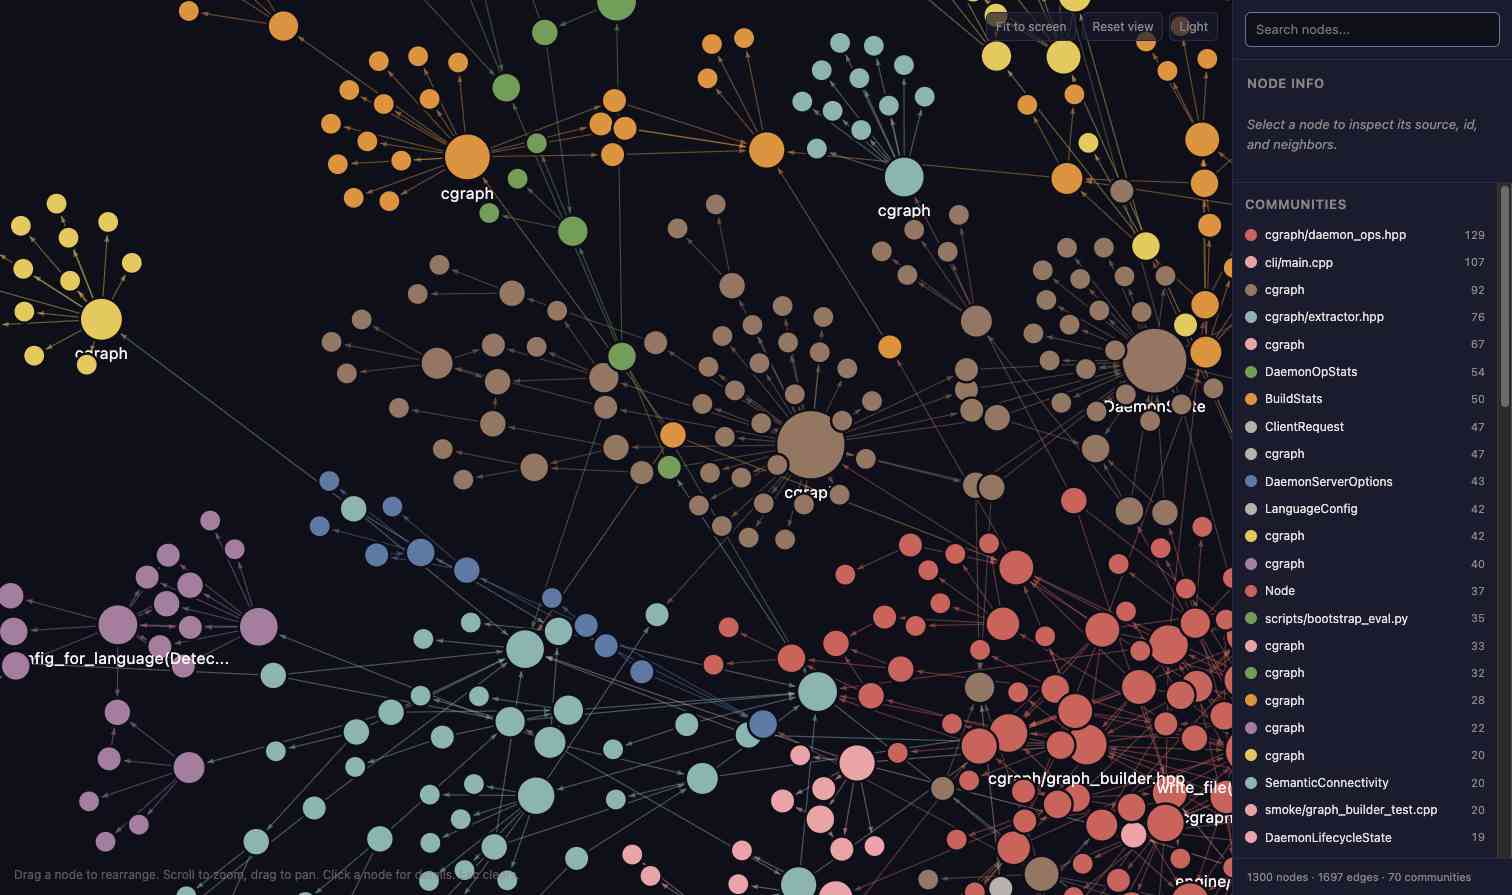
- Layout. Nodes are positioned by a Fruchterman–Reingold-style force simulation that cools over animation frames. Initial positions use deterministic per-node jitter (a seeded hash, not
Math.random), so the same graph lays out the same way on every load. And when the C++ engine has already stamped a precomputed igraph layout into each node's properties, the viewer adopts those coordinates verbatim and skips the browser simulation entirely — a large graph renders near-instantly instead of paying an O(N²) cool-down. - Communities. Nodes carry a
properties.community, clusters are seeded around a ring so each starts in its own region, and each community gets a stable color from the Tableau 10 palette. The sidebar lists communities next to search, node details, and the node/edge counts. - A label budget. Only the 24 highest-degree nodes are labelled at rest. Everything else stays reachable through hover, selection, search, and zoom — so the overview reads as a map instead of a wall of text.
The viewer opens dark by default (deliberately — it's the tool's signature look, not the site's palette), with light mode behind an explicit toggle.
Embedding it without wrecking the page
A 1.2 MB iframe is a terrible thing to ship eagerly on a content page. The embed is a client-side facade component:
{loaded ? (
  <iframe
    src="/demos/cgraph/graph.html"
    sandbox="allow-scripts"
    loading="lazy"
    title="Interactive CGraph knowledge graph of the CGraph repository"
  />
) : (
  <button onClick={() => setLoaded(true)}>Load the interactive graph</button>
)}
Three properties fall out of this:
- Nothing transfers until asked. The facade is a styled button showing the real counts ("161 files → 1,300 nodes · 1,697 edges") and an honest size warning. The viewer's ~1.2 MB moves only after a click.
- Nothing shifts. The frame has a fixed 16:10 aspect ratio with a minimum height, so the facade-to-iframe swap causes zero layout shift.
- Nothing escapes. The iframe is sandboxed to
allow-scriptsonly — the viewer can run its canvas renderer but gets no same-origin access, no top-navigation, no forms.
And this is what the click buys — the full graph, pannable and zoomable:

One layout wrinkle worth stealing: the viewer switches to its desktop layout (canvas plus sidebar) only above 840px of width, so the figure breaks out of the ~820px article column to min(1100px, 100vw - 3rem). Embedding it at column width would permanently trap it in its mobile layout.
Provenance, and refusing to publish a viewer that phones home
A demo of real output is only worth something if it stays real. The asset is regenerated by a script that walks a fixed pipeline:
It parses the build summary line for the counts, then writes a provenance.json next to the HTML:
{
  "repo": "https://github.com/taylor009/CGraph",
  "commit": "dd80379",
  "generatedAt": "2026-07-12",
  "cgraphVersion": "cgraph-native 0.1.0",
  "files": 161,
  "nodes": 1300,
  "edges": 1697
}
The demo component imports that file and renders it verbatim — the caption's commit link and the facade's counts are never hand-edited, so they cannot drift from what actually produced the artifact.
The script also enforces the self-containment claim instead of trusting it:
# The viewer must stay fully self-contained — refuse to ship one that phones out.
if grep -qE 'src="https?://|href="https?://[^"]*\.(js|css)' "$TMP/out/graph.html"; then
  echo "error: graph.html references external assets; refusing to publish" >&2
  exit 1
fi
If a future exporter change ever introduced a CDN script or external stylesheet, the regeneration fails loudly rather than quietly shipping a viewer that phones home.
Try it
Load the live graph on the CGraph project page and click around — every node is the real function, class, or file it claims to be. Then run it on your own repository:
cgraph --root . --out cgraph-out
open cgraph-out/graph.html
The same build also writes Obsidian, Cypher, and SVG exports if a web viewer isn't the shape you need — and if you want the graph queryable rather than viewable, start with feeding your codebase to Claude Code.